- Published on
Interactive Business Dashboards for Smarter Decision-Making
- Authors

- Name
- ByteGeometry
- @ByteGeometry
Business Analytics Dashboards That Put You in Control
Context
Many businesses operate with valuable data scattered across multiple databases, applications, and departments. Without a unified view, teams often spend hours manually compiling reports, leading to slow decision-making and missed opportunities. Our client needed a single platform where executives, managers, and analysts could monitor business KPIs, track trends, and explore data in real time - all without requiring complex technical skills.
Solution
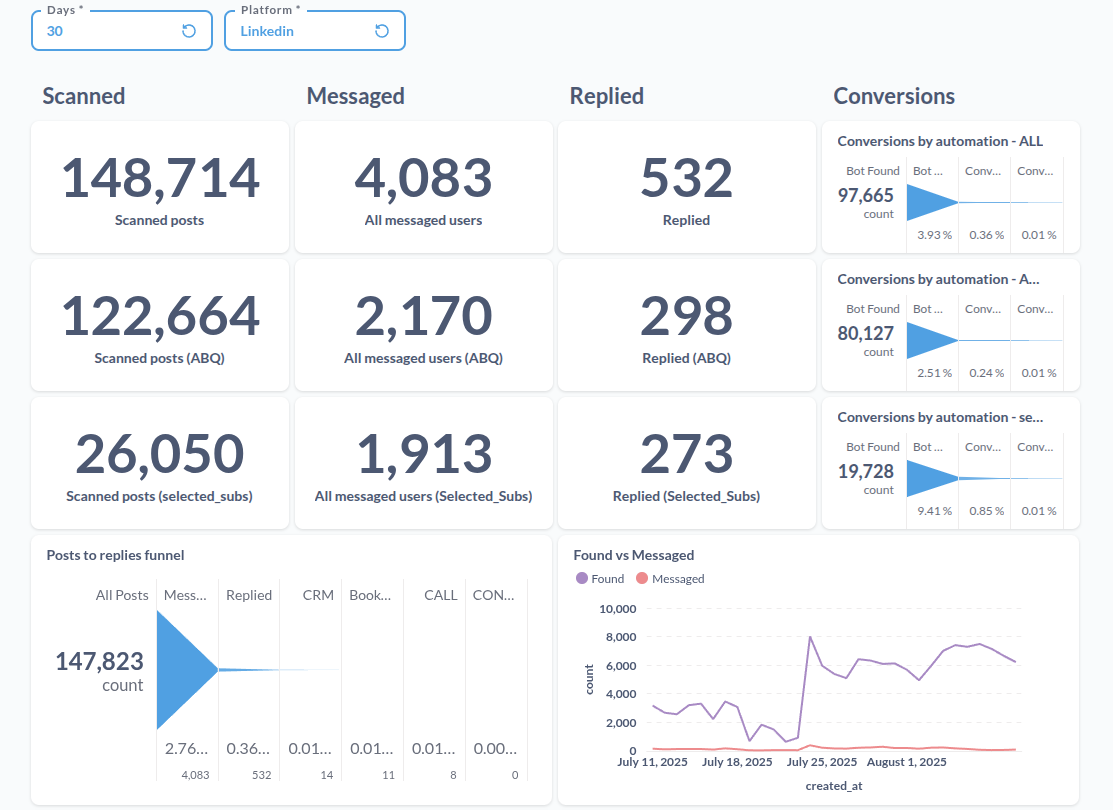
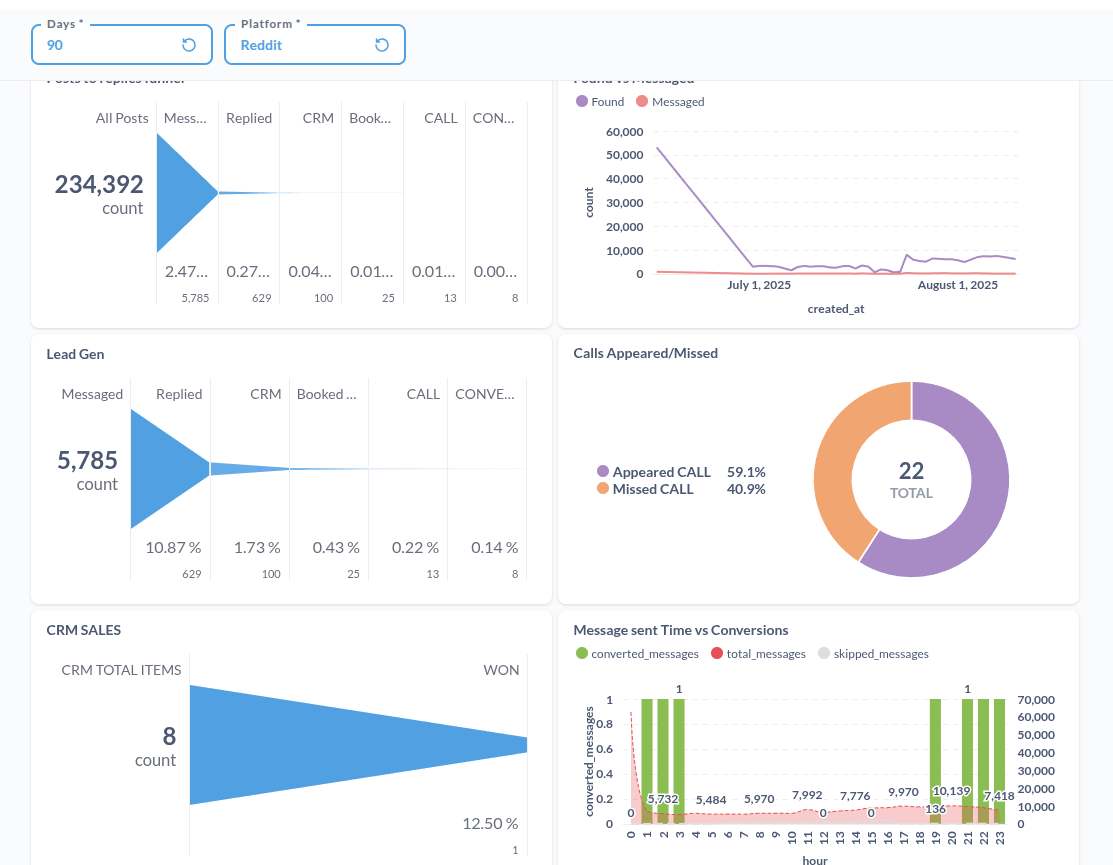
We designed and delivered a fully custom business analytics dashboard tailored to the client’s operations. The dashboard integrates seamlessly with their existing data infrastructure, providing a clean and intuitive interface where users can quickly navigate through performance metrics, filter information, and drill down into the details that matter most.
At the core of the solution is Metabase, which we implemented as the SQL analytics layer. This allowed the client’s team to query data directly, visualize trends, and create custom reports without writing complex code. By designing the dashboards around Metabase’s strengths, we ensured flexibility for both technical and non-technical users.
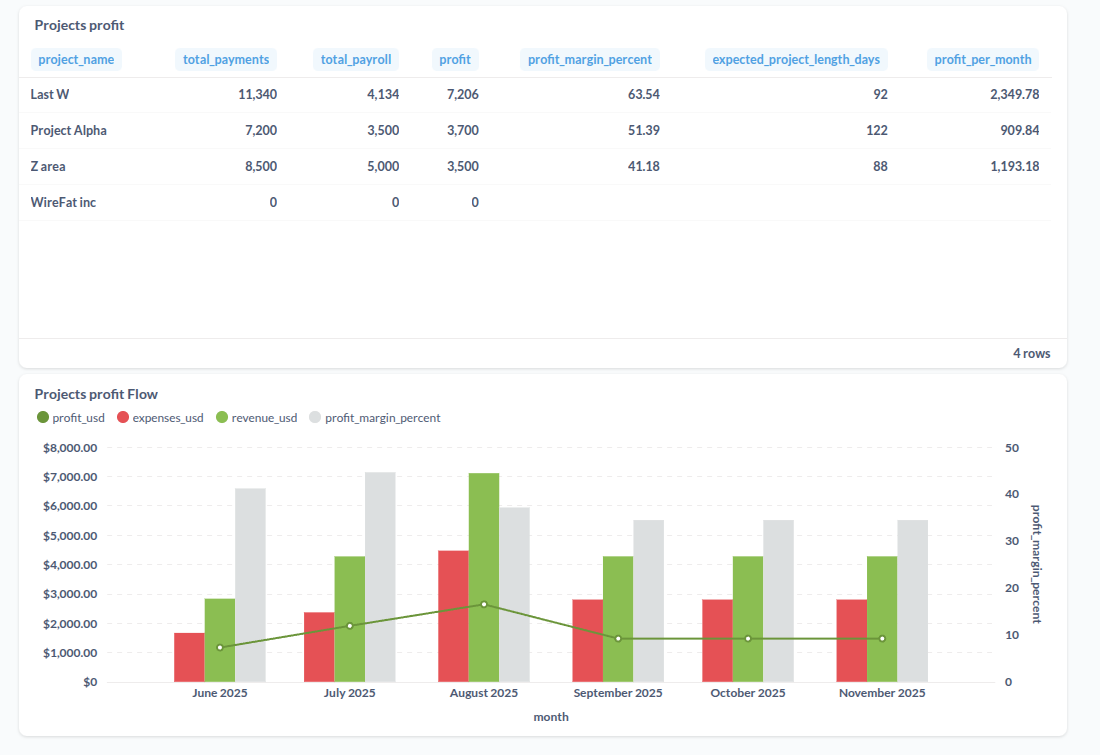
To unify data from multiple databases and systems, we implemented PostgreSQL Foreign Data Wrapper (FDW) technology. This approach enabled the dashboard to pull live data from various schemas - such as CRM, financial, and operational datasets - into a single PostgreSQL instance, ensuring the information was always up-to-date and consistent. The result was a streamlined analytics workflow that eliminated manual report-building and reduced the risk of errors.

Technology and Tools
Metabase for SQL analytics and interactive visualizations, PostgreSQL with FDW for cross-database data integration, custom dashboard UI/UX design for ease of navigation, and automation scripts for scheduled data refreshes.
Results
The new dashboards gave the client real-time visibility into their business performance, enabling faster, data-driven decision-making. Reporting time was reduced from days to minutes, interdepartmental collaboration improved significantly, and executives gained the ability to track KPIs on-demand - resulting in better strategic planning and measurable business growth.